
Home/Technology/Technical data
The numbers behind the lining.
Physical and mechanical properties, thermal shock limits, heat transfer coefficients and corrosion behaviour — the data your process engineer needs before specifying glass lined equipment.
Physical properties
Properties of the fired glass lining.
Values apply to STAHL GLAS lining as fired on the steel substrate. The chemical bond between glass and steel means no interface heat transfer resistance needs to be taken into account.
- Thickness
- 1 – 2.2 mm
- Specific weight
- 2.5 g/cm³
- Tensile strength
- 70 N/mm²
- Compressive strength
- 800 N/mm²
- Hardness (HV)
- 700 kg/mm²
- Coefficient of thermal conductivity
- 1.2 W/m·K
- Specific heat
- 0.82 kJ/kg·K
- Electrical resistivity
- 1013 Ω/cm at ambient temperature
- Dielectric strength
- 20 – 30 kV/mm
- Modulus of elasticity
- 75,000 N/mm²
- Elongation
- 0.1 %
- Abrasion
- 3.5 mg/min
- Flexibility
- The lining follows the base metal through bending until the metal itself undergoes permanent deformation.
- Chipping tendency
- None arises under normal operating conditions.
- Surface
- Exceptionally smooth — easy to clean, with excellent wear resistance and gas impermeability, preventing sticking and micro-flora growth. Biologically sterilisable with base.
- Structural behaviour
- Being electrically neutral, the lining eliminates any possibility of electrochemical corrosion. It resists ageing, does not owe its properties to an amorphous structure breaking down, and withstands weathering effectively.
Thermal shock resistance
The single most common cause of lining failure — and it is avoidable.
Any sudden temperature change on either the glass side or the jacket side has the potential to damage the lining and must be avoided. The most damaging thermal shocks come from splashing cold product onto a hot glass surface. That triggers fine surface cracks which go on to cause lining failure. Most thermal shock damage shows itself as flaking of the lining in relatively small but thick pieces of glass with a characteristic shape.
Reading the chart
The left half of the figure gives the maximum and minimum temperature of the fluid introduced into the jacket, for various product temperatures in the reactor. For example, if the product and the glass wall are at 140 °C, the fluid entering the jacket must be between −15 °C and 255 °C.
The right half gives the maximum and minimum temperature of the product charged into the reactor, for various temperatures of the glass and the heating or cooling fluid in the jacket. For example, if the jacket fluid and glass wall are at 180 °C, the product entering the reactor must be between 50 °C and 255 °C.
Apply an 80 % margin
For safe operation of the equipment, take 80 % of the figures in the chart as your working guideline — not the chart values themselves.
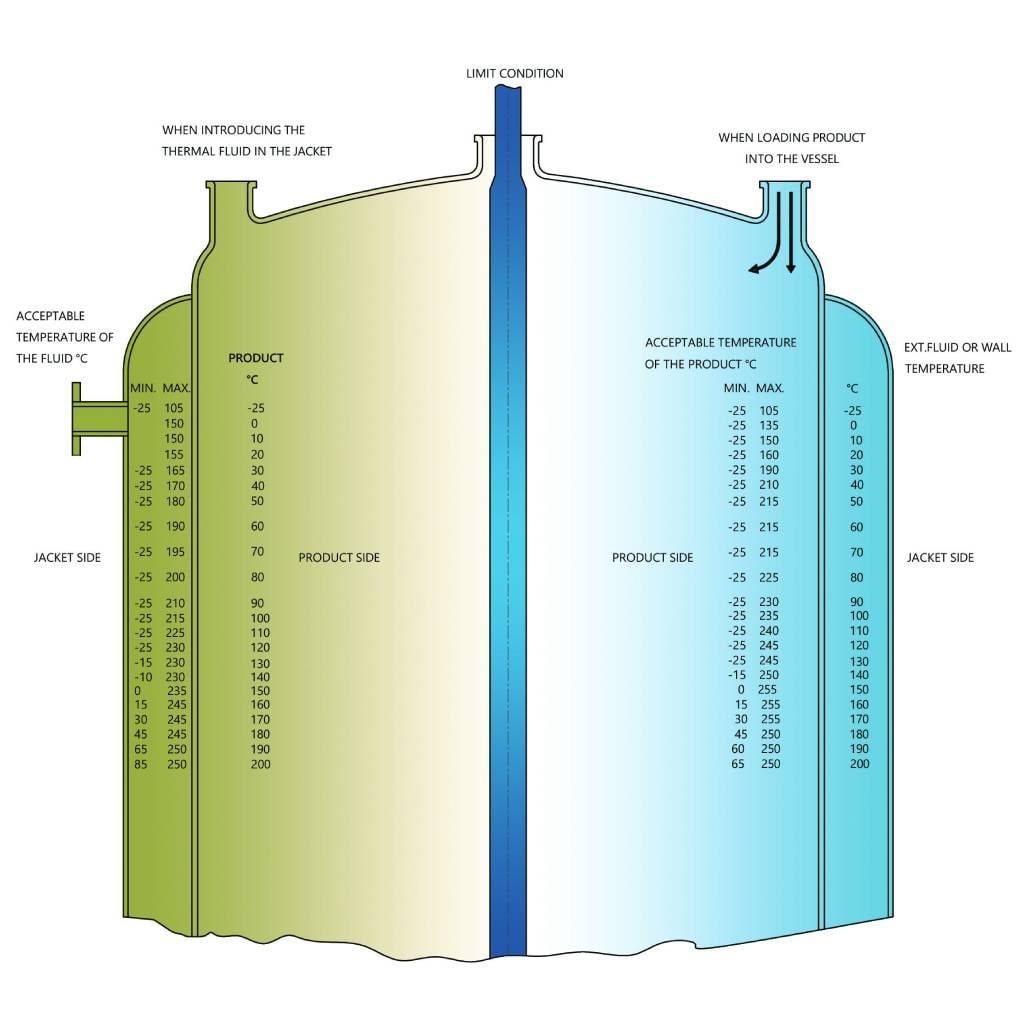
Selected limits from the chart
| Product / wall temperature | Jacket fluid may be | Jacket / wall temperature | Charged product may be |
|---|---|---|---|
| −25 °C | −25 to 105 °C | −25 °C | −25 to 105 °C |
| 20 °C | −25 to 155 °C | 20 °C | −25 to 160 °C |
| 60 °C | −25 to 190 °C | 60 °C | −25 to 215 °C |
| 100 °C | −25 to 215 °C | 100 °C | −25 to 235 °C |
| 140 °C | −10 to 230 °C | 140 °C | −15 to 250 °C |
| 160 °C | 15 to 245 °C | 160 °C | 15 to 255 °C |
| 180 °C | 45 to 245 °C | 180 °C | 45 to 250 °C |
| 200 °C | 85 to 250 °C | 200 °C | 65 to 250 °C |
Values read from the thermal shock figure above. Intermediate temperatures should be read off the chart itself; the figure is the authority, this table is a convenience.
Thermal conductivity
Thin glass on steel behaves better than the glass alone suggests.
Steel allows the glass lining to be kept relatively thin compared with self-supporting glass equipment. The low thermal conductivity of the glass is therefore counter-balanced by the high heat transfer coefficient of the steel — and because glass and steel are chemically bonded, no interface heat transfer resistance needs to be taken into account.
| Service | Fluid in jacket | Fluid in vessel | U (W/m²K) |
|---|---|---|---|
| Heating | Steam | Organic liquid | 345 – 469 |
| Steam | Aqueous liquid | 403 – 520 | |
| Oil | Organic liquid | 192 – 269 | |
| Oil | Aqueous liquid | 278 – 315 | |
| Condensing | Water | Organic liquid | 155 – 180 |
| Water | Aqueous liquid | 178 – 219 | |
| Cooling | Water | Organic liquid | 113 – 187 |
| Water | Aqueous liquid | 123 – 178 | |
| Brine | Aqueous liquid | 74 – 145 |
Values of overall heat transfer coefficient for various heating and cooling conditions. Actual performance depends on agitation, fill level, fouling and jacket configuration — use these as a design starting point, not a guarantee.
Corrosion resistance
What attacks glass lining, and what does not.
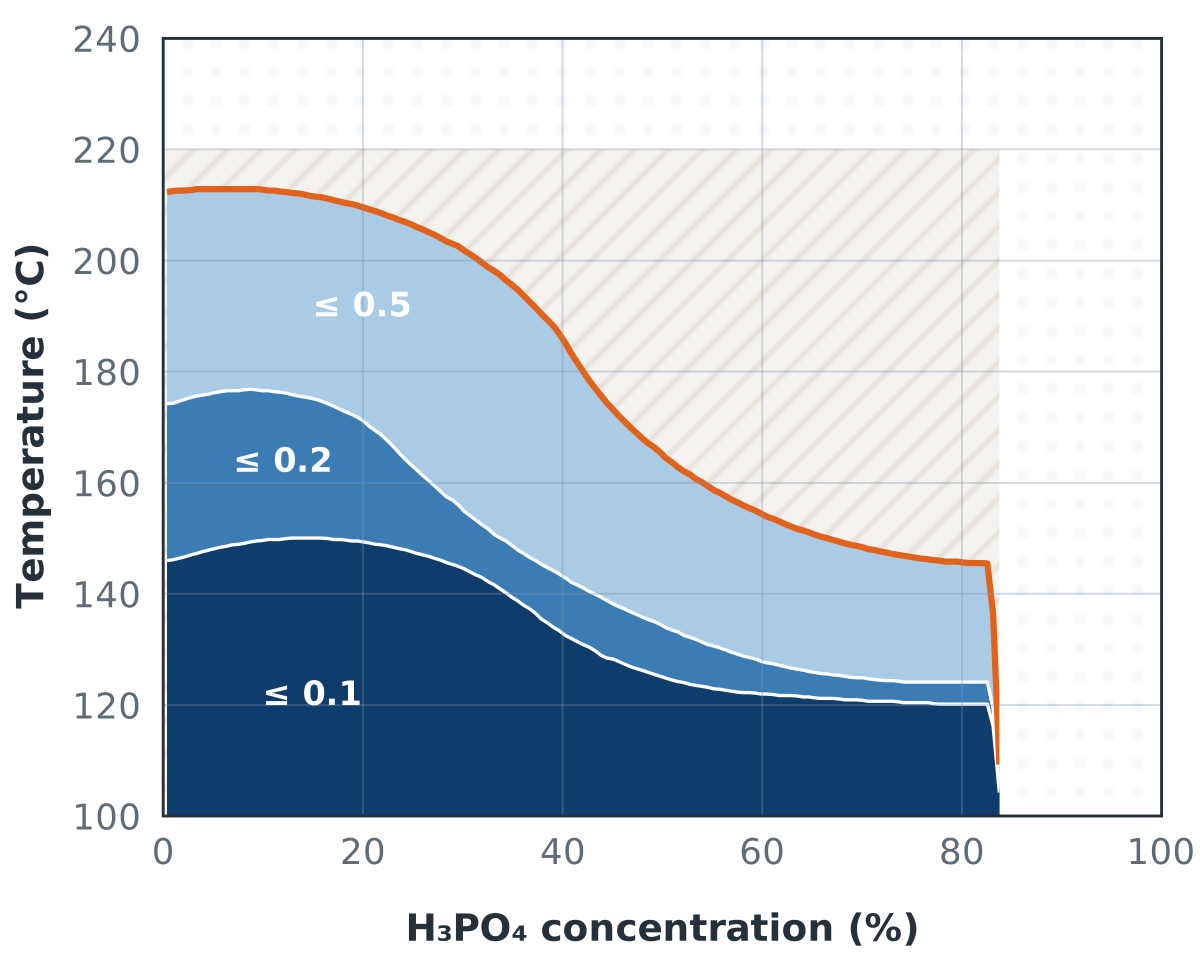
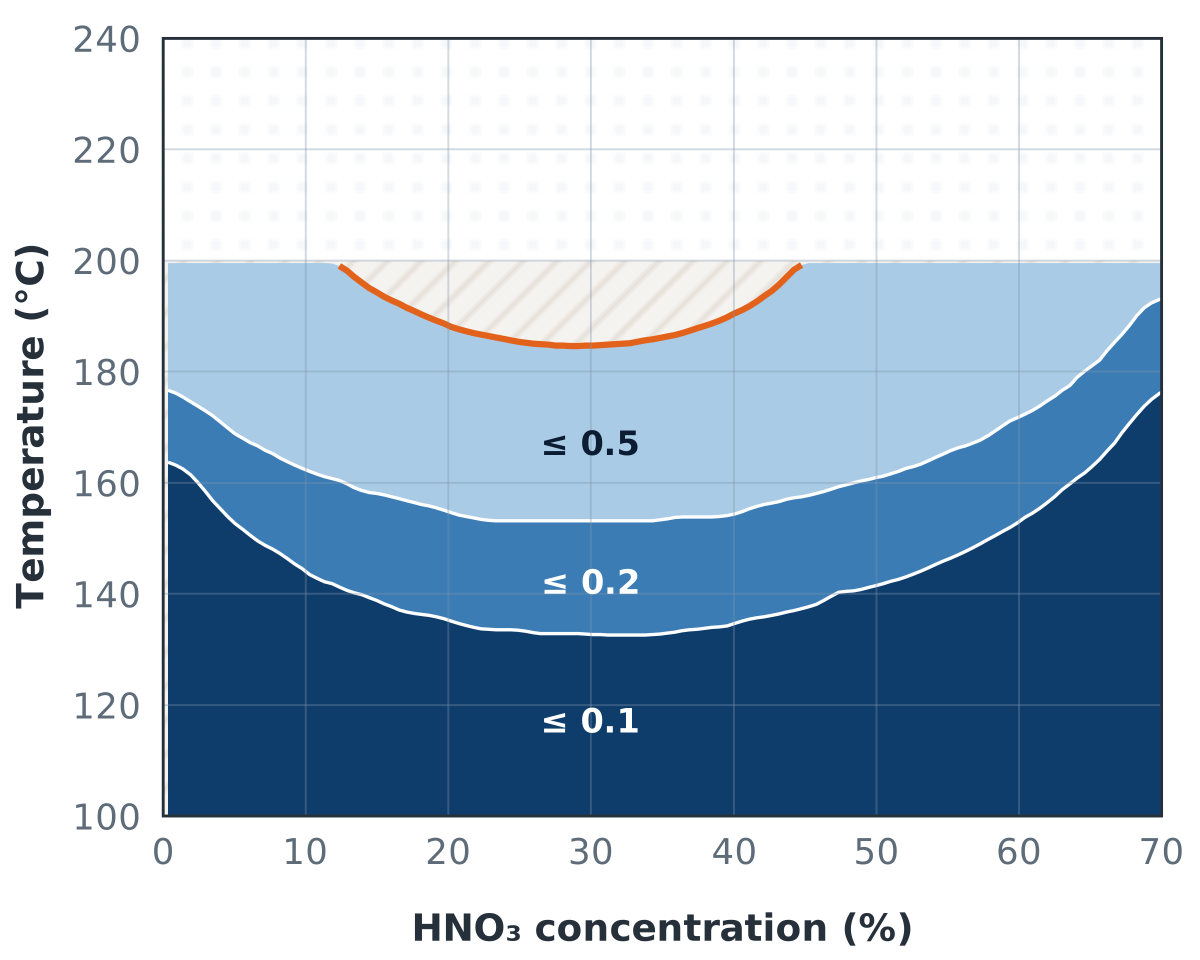
The type of corrosive substance together with the temperature governs the effect of concentration. Concentrated acids are generally less corrosive than diluted acids — with the exception of phosphoric acid. Concentration, pH, temperature and agitational forces all influence the rate.
Temperature limits across the pH scale
- Fully resistant
- Resistant with limits
- Not recommended
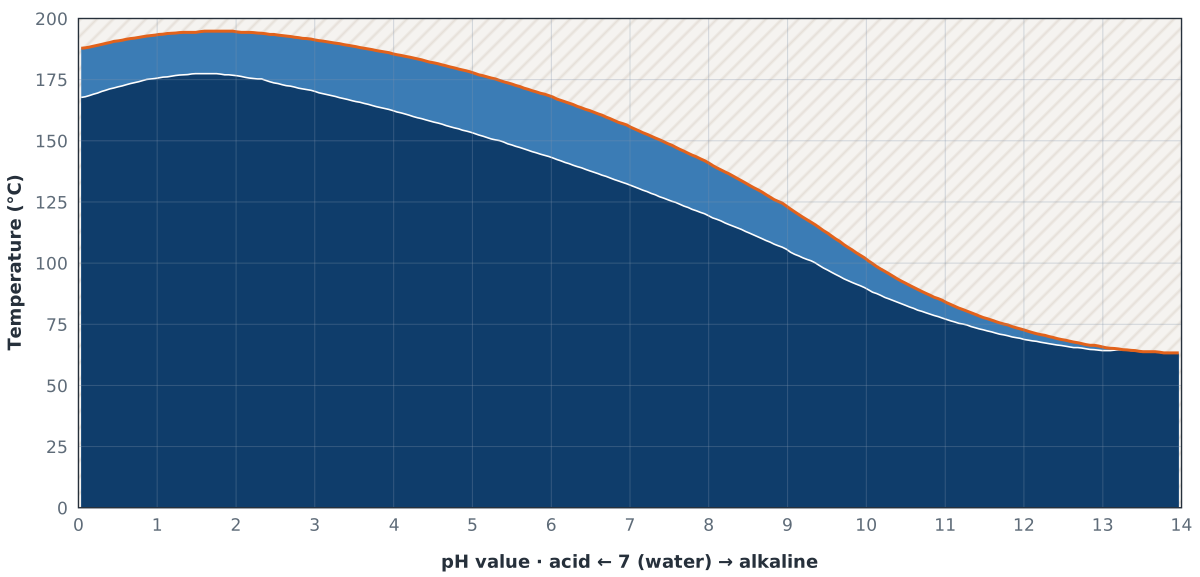
Iso-corrosion charts for acids and alkalis
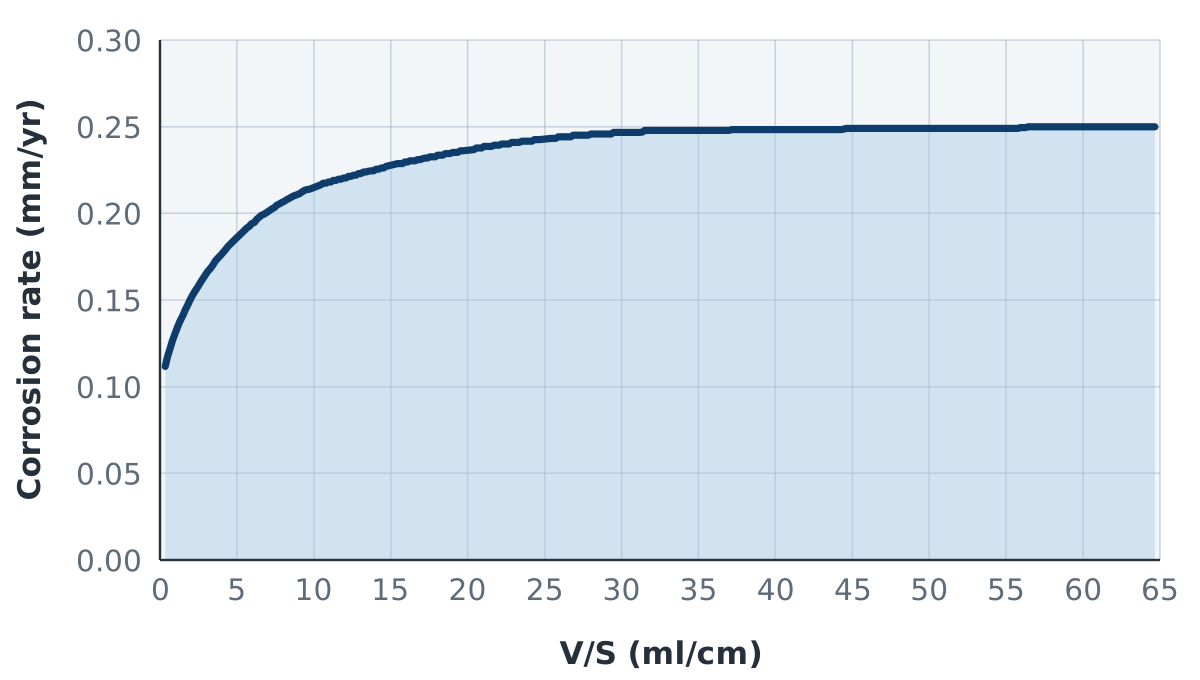
Each chart maps the corrosion rate of the lining against concentration and temperature. The zones are bounded by iso-corrosion lines, and the orange line marks 0.5 mm per year. All curves were generated at a volume-to-surface-area ratio of V/S = 20 with reagent-grade chemicals. Click any chart to enlarge it.
- ≤ 0.1 mm/yr — fully resistant
- 0.1–0.2 mm/yr
- 0.2–0.5 mm/yr
- > 0.5 mm/yr
- 0.5 mm/yr line
- Outside the charted range
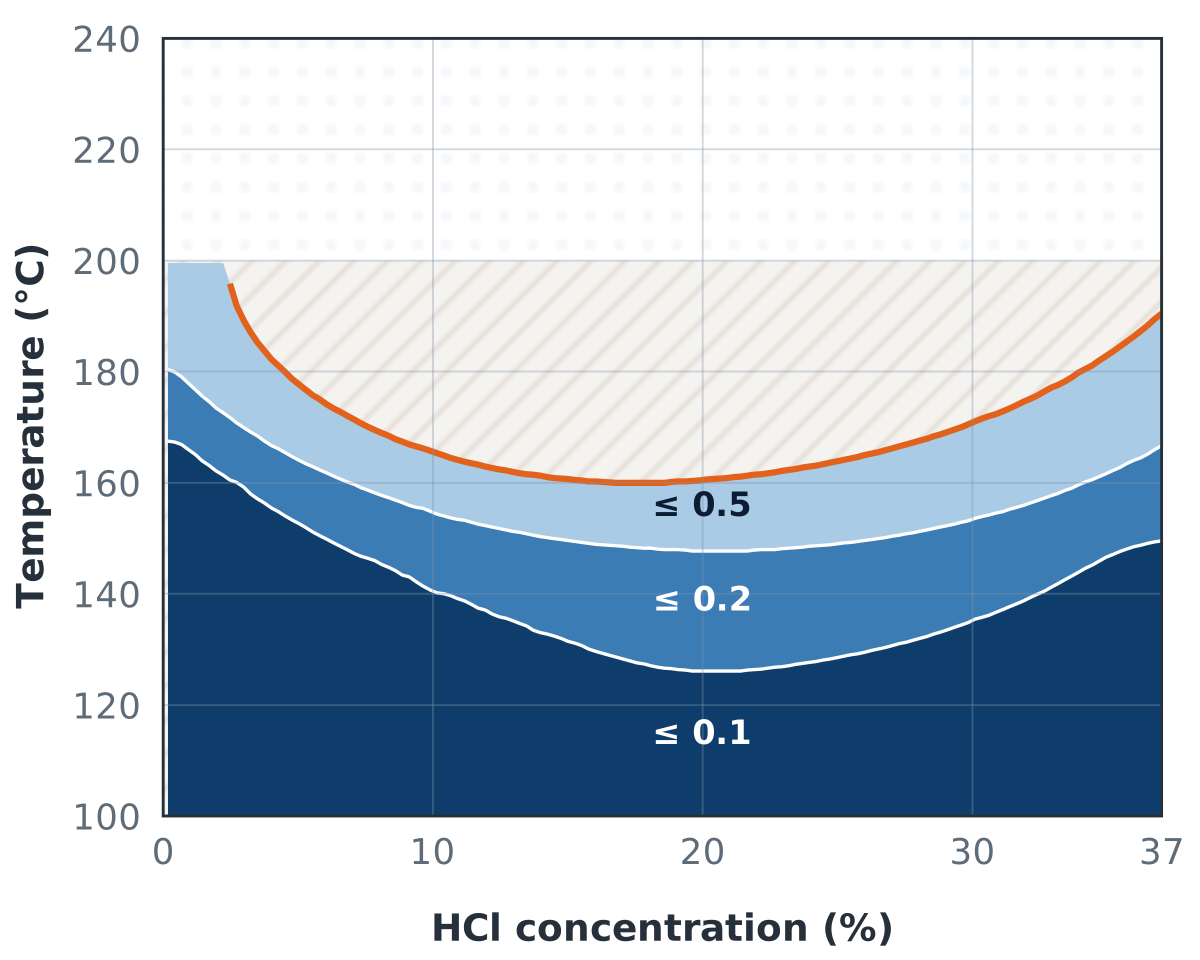
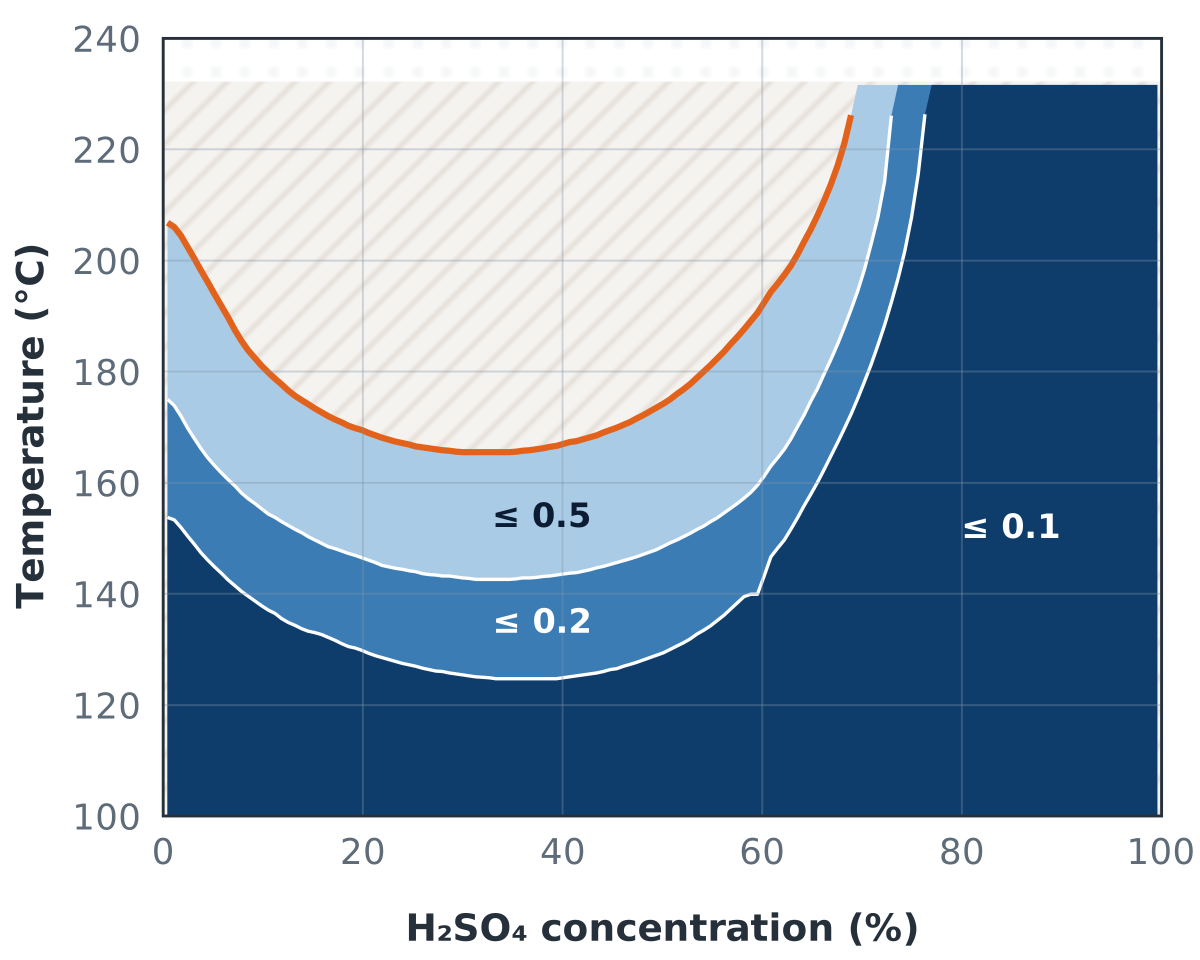
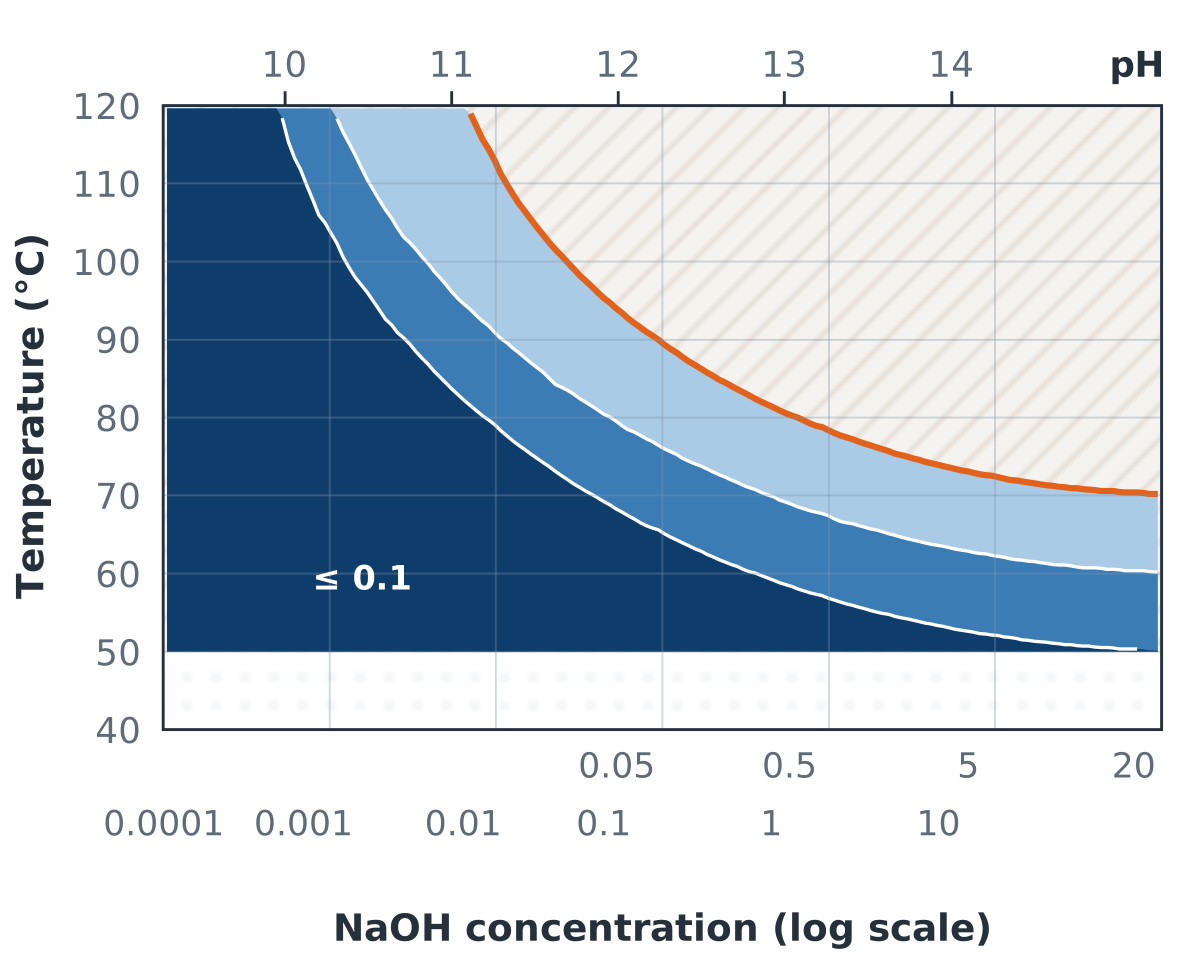
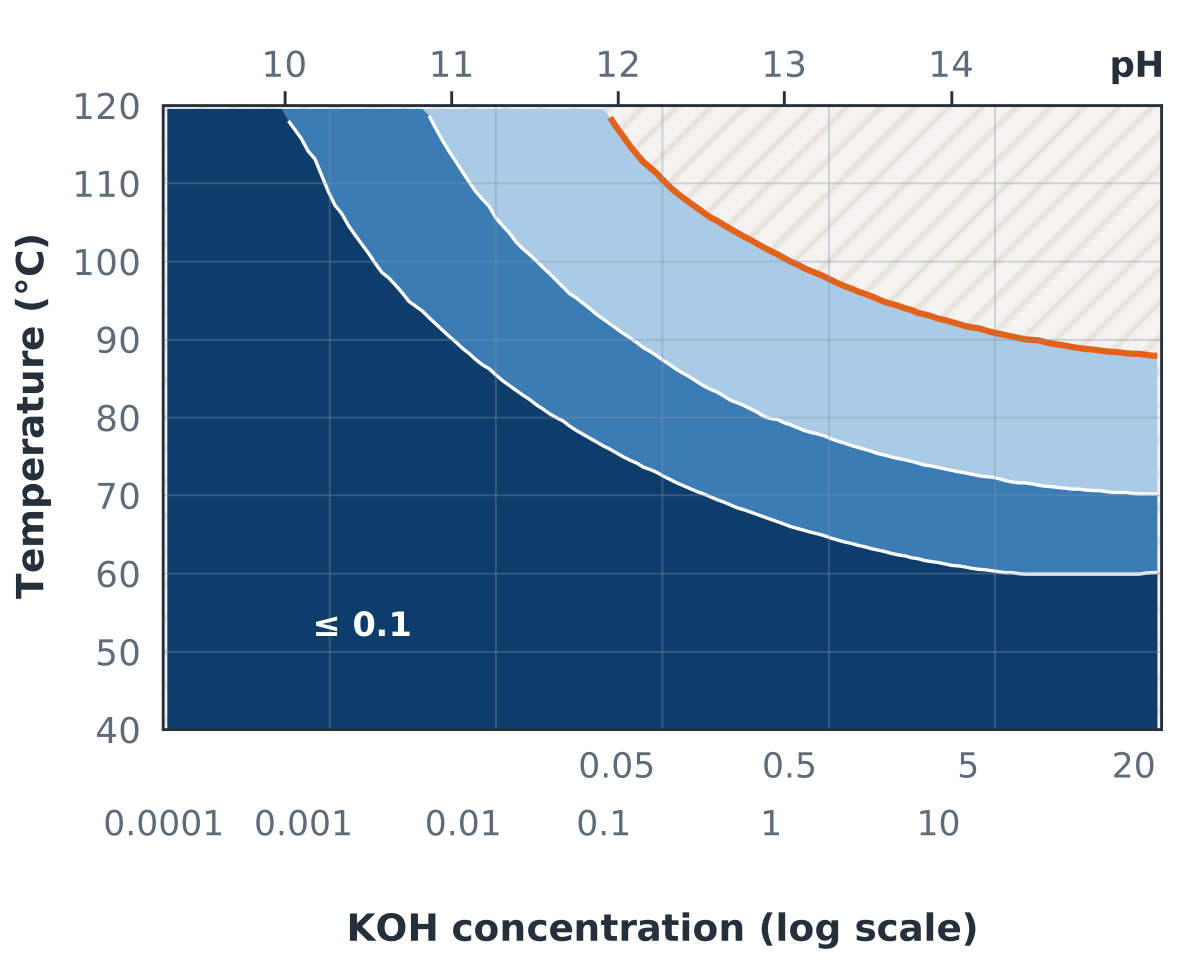
Alkali charts: the concentration scales are reproduced from the original test charts, and the upper axis shows the corresponding pH.
Process factors that change the corrosion rate
Substance
STAHL GLAS Blue Glass offers a high degree of resistance to acids, bases, solvents, gases, uncondensed vapours and melted salts of acidic, natural or anhydrous nature — at relatively high temperature and at all concentrations.
Temperature
Temperature exerts a strong effect on corrosion for both acids and bases. The corrosion rate for bases roughly doubles for every 10 °C rise. At pH 14 (NaOH) the maximum permissible limit stands at 57 °C. Exposure time also matters: with acids the rate declines as exposure lengthens, while bases maintain a constant rate with time.
Acids
Excellent resistance to all acids — organic and inorganic, oxidising and reducing. Iso-corrosion curves have been developed for the most common acids from reagent-grade laboratory tests; in practice velocity, phase type and chemical grade also influence the rate. As phosphoric acid concentration rises it becomes more aggressive towards glass: at 85 % concentration the maximum useable temperature is 95 °C.
Bases
Bases tend to be more corrosive than acids. As concentration rises, so does the corrosion rate; as temperature rises, an increase of 10 °C doubles the rate of attack. Caution is essential when using hot alkalis.
Water
Water can cause severe corrosion, and the risk rises with water purity. Condensed water droplets on the colder glass surface in vapour phase leach alkali ions out of the glass network. Keep vessel contents slightly acidic, and insulate an un-jacketed top dish to reduce condensation. Our CERA 9011 is competent to combat corrosion in vapour phase environments.
Corrosion inhibition
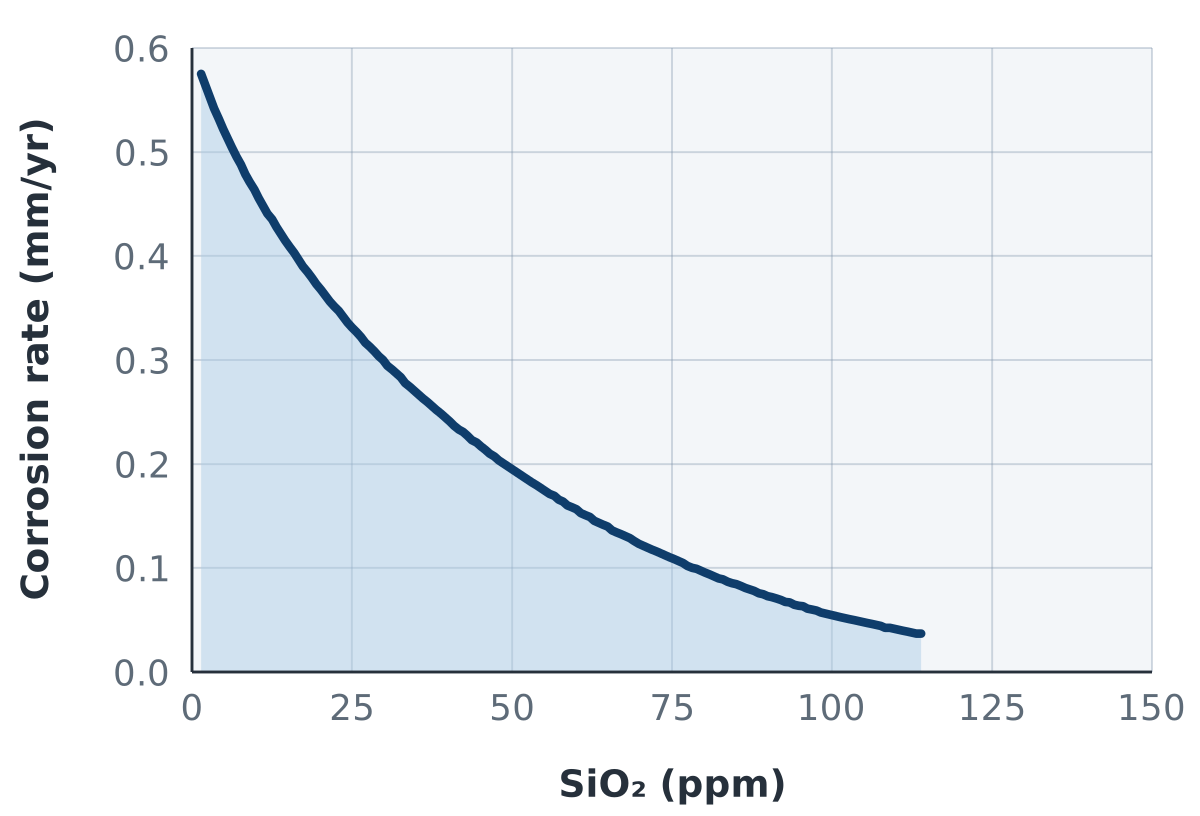
Where reactions are severe enough to wear the lining rapidly, additives can inhibit the attack. Several hundred ppm of silica protects the lining in acid service in the liquid phase; silicone oils achieve the same in vapour phase. Generally the higher the temperature the more silica is needed, and the more concentrated the acid the less. In the presence of fluorine, silica also exerts a favourable influence. With alkalis, a few hundred ppm of calcium, aluminium or zinc can reduce corrosion, especially in dilute solutions.
Hydrofluoric acid destroys glass lining
It is well known that hydrofluoric acid can completely destroy a glass lined vessel. Even at concentrations as low as 20 ppm, fluorides in an acid environment have a devastating effect on the glass surface — especially in continuous reactions where HF is repeatedly replenished. Hydrofluoric acid attacks the silicon dioxide that is the main ingredient of glass, destroying the SiO2 structure and leaving a rough surface.
Preventing fluoride attack demands constant vigilance. Reactants that may contain fluoride impurities must be analysed to establish the fluoride level before use. Technical-grade phosphoric acid and its salts are frequently fluoride-contaminated, as are other mineral acids.
Mechanical resistance
Compression is what makes brittle glass survivable.
Mechanical properties
Glass carries the disadvantages of brittleness and low tensile strength. The remedy is to place the lining under compression. That happens during cooling of the glassed item after firing, and results from the difference between the coefficients of thermal expansion of the glass and the base metal, combined with the excellent bond between them.
When the glass-steel composite meets a mechanical strain — handling, mechanical shock or thermal shock — that compressive stress must be overcome before the glass is pushed into tension and fails. The residual compressive stress therefore acts as an effective shock absorber.
Abrasion
Abrasion of the lining is simply a wearing away of the glass by abrasive solids in the reactor. It shows first as a loss of fire polish and, in severe cases, as a rough sandpaper-like finish. Experience shows that failure from abrasion alone is very uncommon.
In combination with acid corrosion, however, it can be severe: abrasion compromises the silica network mechanically, allowing acid corrosion to accelerate. STAHL GLAS Blue Glass shows good resistance to abrasion as well as better physical characteristics such as mechanical shock, impact resistance and thermal shock resistance.
Operating guidance
Six habits that decide how long a lining lasts.
Most glass lining failures we are called to are not manufacturing defects. They are operating practice.
Never splash cold onto hot
Charging cold product onto a hot glass wall is the classic failure mode. Respect the thermal shock bands, at 80 % of the chart values.
Watch the jacket, not just the batch
A sudden change on the jacket side does the same damage as one on the product side. Ramp heating and cooling media too.
Analyse for fluoride
Before charging technical-grade phosphoric acid, its salts or other mineral acids, establish the fluoride level. 20 ppm is enough to matter.
Keep contents slightly acidic in vapour service
Condensed pure water leaches alkali from the glass network. Insulate un-jacketed top dishes to reduce condensation.
Limit hot alkali exposure
At pH 14 (NaOH) the permissible limit is 57 °C, and every 10 °C above doubles the attack rate. Cleaning cycles count.
Spark test on a schedule
Pinholes and thinning are found cheaply at inspection and expensively at failure. We run scheduled inspection programmes — see field service.
Standards & tests
What the lining is tested against.
DIN EN ISO 28706
Resistance to chemical corrosion — acids, neutral liquids and alkalis, as applicable to the application.
DIN EN ISO 28721-1
Quality requirements for glass lined apparatus, Part 1.
DIN EN ISO 28721-3
Thermal shock and impact resistance, Part 3.
DIN EN ISO 15695
Scratch and abrasion resistance of the fired glass surface.
Vessel geometry follows DIN 28136 types AE and CE. In-house testing includes spark testing of the complete lining, non-destructive testing by UT, RT and MPI, hydrostatic and pneumatic testing, and full material traceability — see quality & testing.

Engineering support
Check your duty against these limits with us.
If your process sits close to a thermal shock band, a phosphoric acid ceiling or a hot alkali limit, say so early. It is a far cheaper conversation before the order than after the failure.